Creating formulas and parameters in Visualizer
Creating formulas
Workbooks and Visualizer support formulas, enabling advanced data analysis directly within their respective interfaces. This feature enhances data analysis capabilities, providing greater flexibility and control over data insights.
-
Only users with Creator or Editor permissions for the workspace can add a formula column.
-
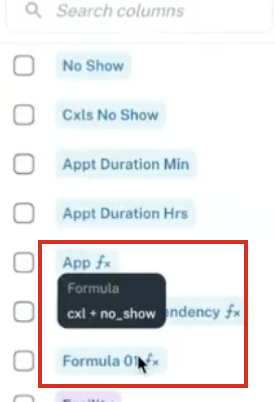
Formula columns are visually distinguished and marked with an indicator. A tool tip is shown when you hover over the formula, which displays the details of the formula.
-
In formula addition, static workbooks exclusively use Spark functions, while dynamic workbooks utilize JDBC functions.
You can create formula columns directly within Visualizer at the workbook level. These formulas can be used interchangeably in both Visualizer as well as Workbook.
To add a Formula column directly from Visualizer, do as follows:
-
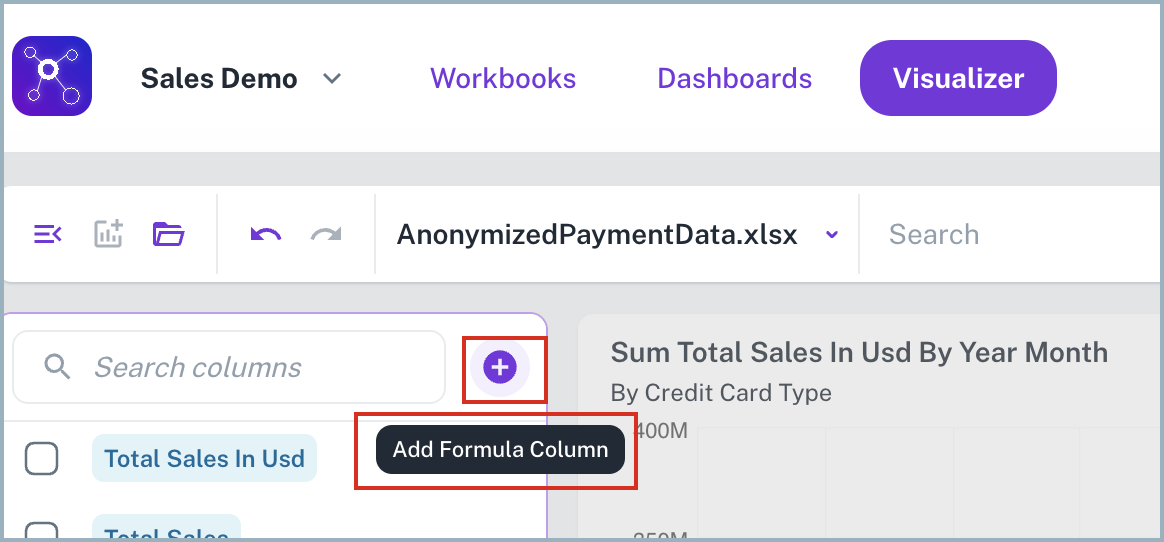
From Visualizer, adjacent to list of columns on the left, click the Add Formula Column button.
-
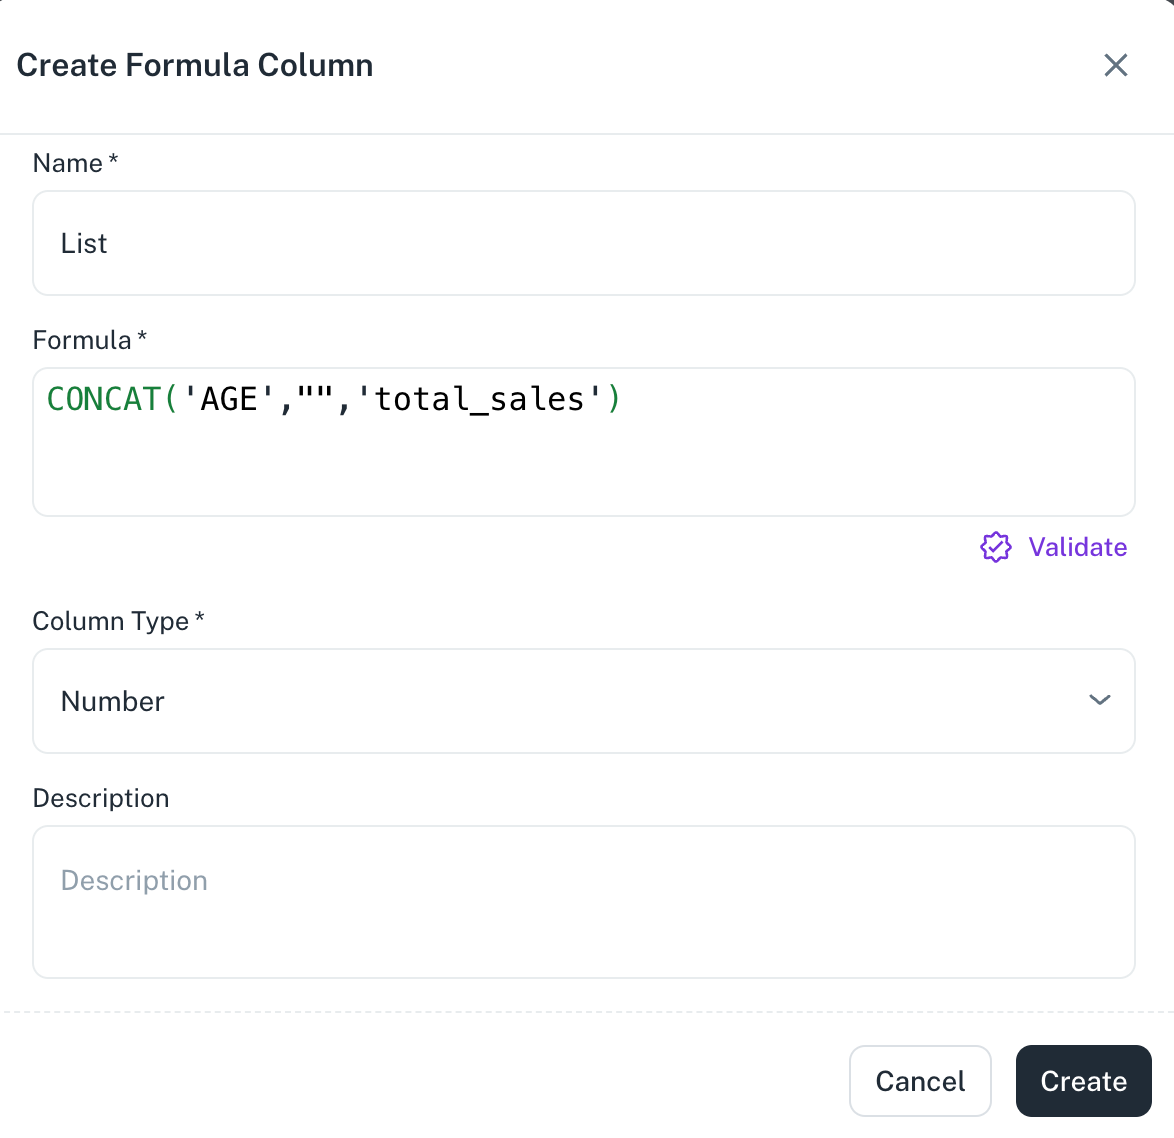
In the Create Formula Column box, provide the details such as Name, Formula, Column Type, and Description. Refer the Formula handbook for more details.
-
Click Create.
Using Formulas and Parameters
After adding the formula, you can do the following:
-
Use the created formulas as filters in the Visualizer. For example, create a formula -
PrevYear(TRUE, FALSE)and then use this formula as a filter criterion on a widget. -
Include parameters or variables available within your workspace, even those defined in other workbooks, in your formulas. You can directly create these parameters from Visualizer and add them while creating formulas using double curly braces.
-
Create even more powerful calculations by using existing formulas within new formulas. See Creating parameters for formulas from visualizer
Creating parameters for formulas from Visualizer
Parameters in BI tools empower users to dynamically control data views and interact with dashboards without altering the underlying data. They enhance flexibility by enabling what-if analysis, metric switching, and custom filtering.
To add parameters from the Visualizer, do the following:
-
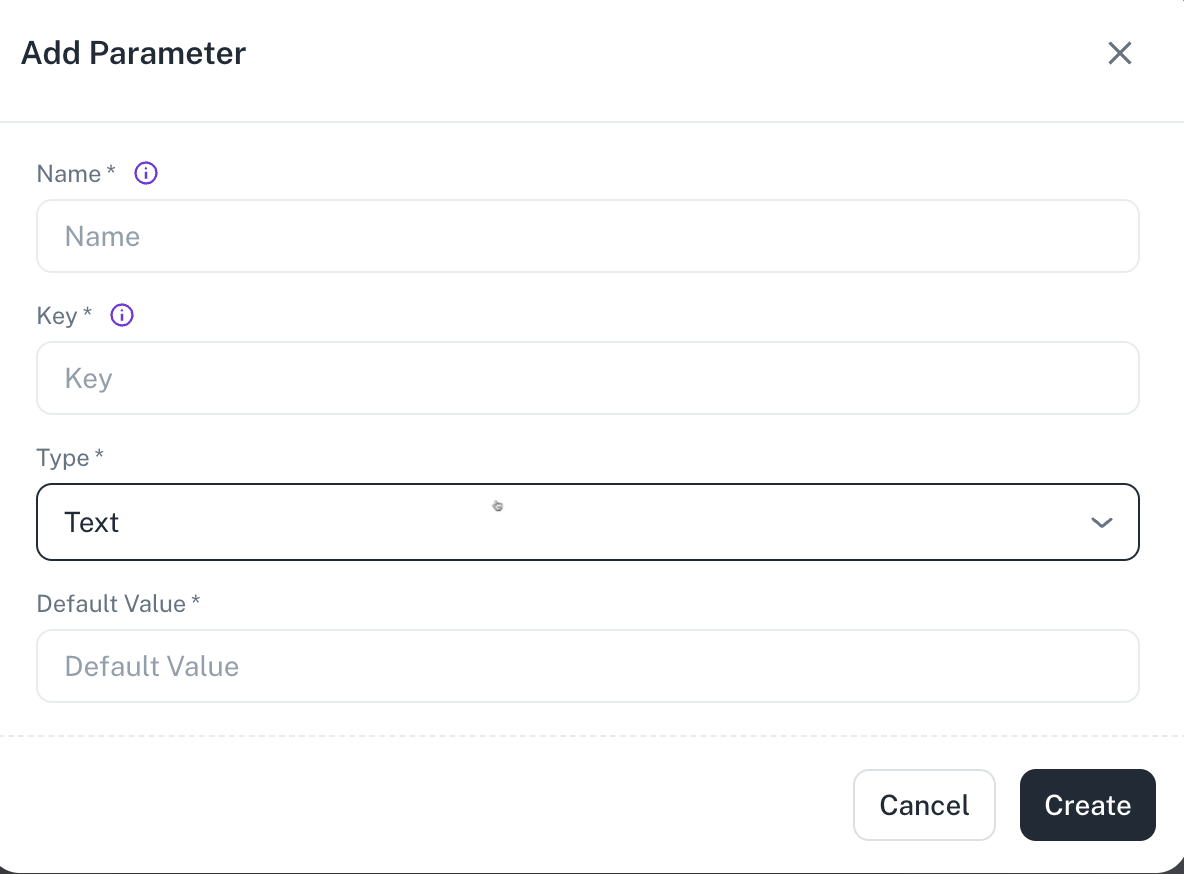
From Visualizer, adjacent to list of columns on the lower left, click the Create Parameter button.
-
Add the following details in the Add Parameter box:
-
Name: Specify a unique name for the parameter.
-
Key: Select a unique identifier for your parameter, such as year.
-
Type: Select the data type for the key from TEXT, NUMBER, BOOLEAN, DATE, DATE TIME, DATE RANGE, DYNAMIC ENUM, STATIC ENUM.
For example, If you have want to specify the default value as year, you can select NUMBER type. -
Default Value: Specify a default value, such as 2025.
-
-
Click Create. The created parameters are listed in the Parameters section.